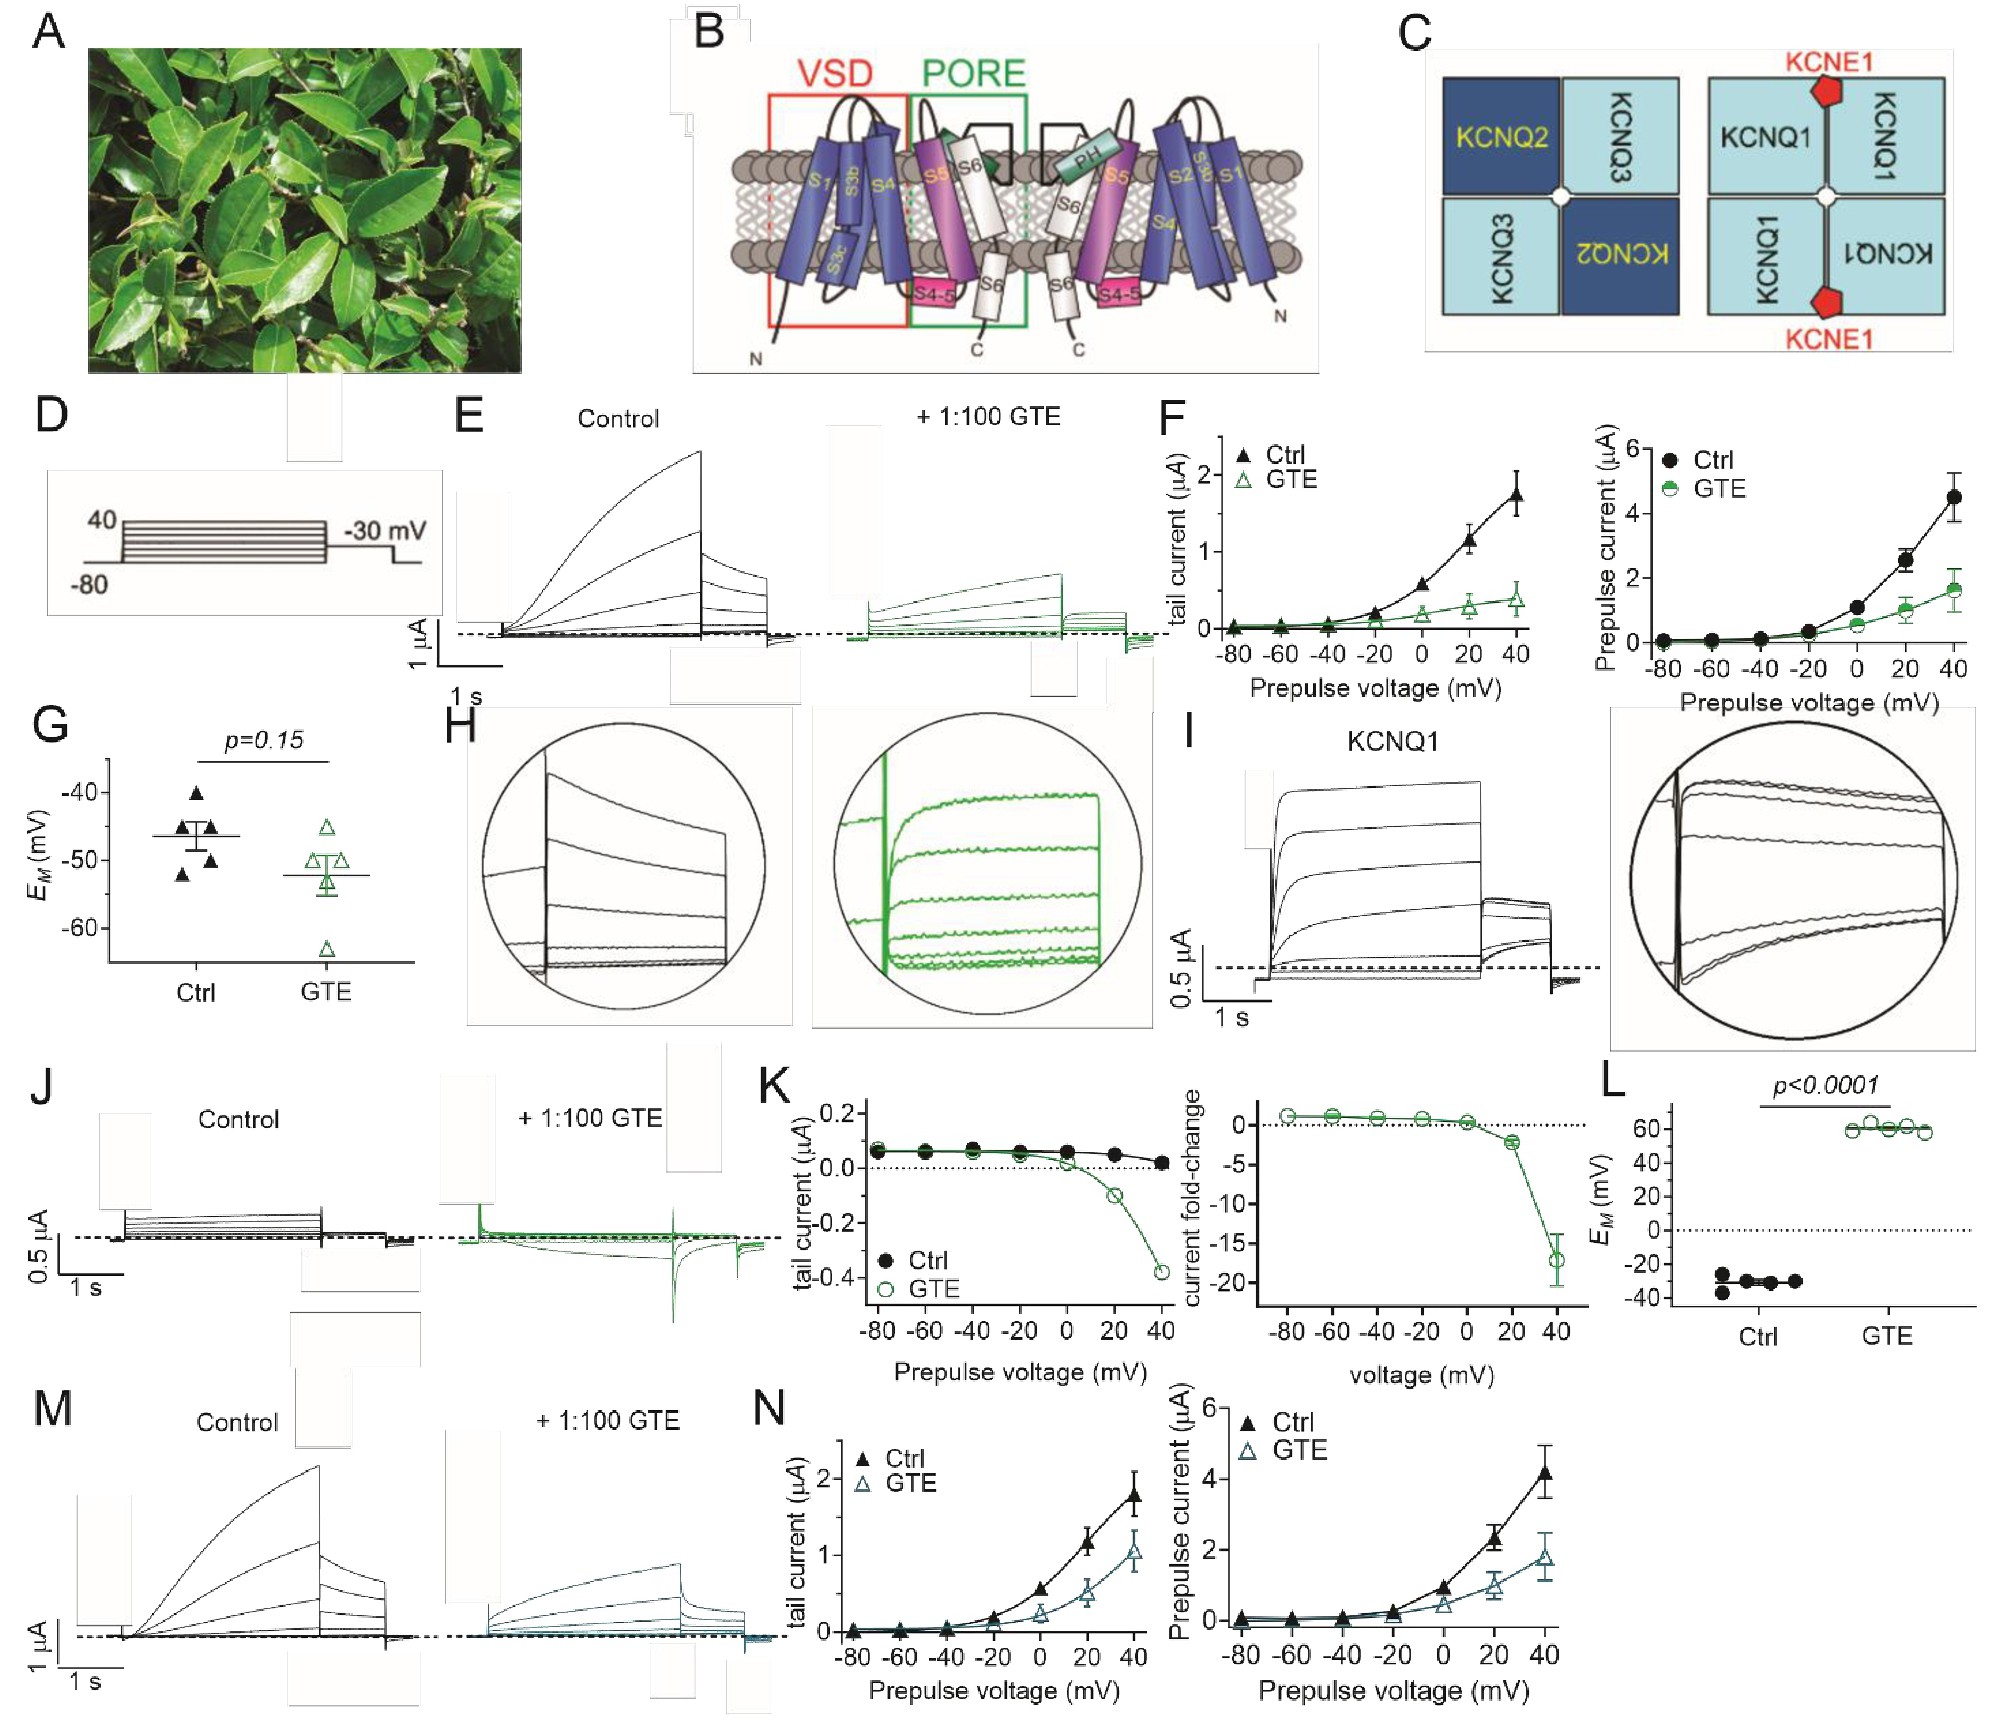
Fig. 1. Green tea extract inhibits KCNQ1/E1 channels. All error bars indicate SEM. A: Image of the tea producing plant, Camellia sinensis. B: Topological representation of a Kv channel showing two of the four α subunits that comprise a channel. PH, pore helix; VSD, voltage sensing domain. C: Schematic of heteromeric composition of KCNQ2/KCNQ3 (left) and KCNQ1/KCNE1 (right) channels. D: Voltage protocol used throughout the study (20 mV prepulse increments). E: Mean TEVC current traces for KCNQ1/E1 cRNA-injected Xenopus oocytes (10 ng/ 2 ng) as indicated, in the absence (Control) or presence of 1% green tea extract (GTE) (n = 5). Dashed line here and throughout indicates the zero-current level. F: Left, mean tail current; right, mean prepulse peak current verses prepulse voltages for traces as in E (n = 5). G: Scatter plot of unclamped membrane potential (EM) for cells as in E (n = 5). Statistical analyses by two-way ANOVA. H: Magnified mean tail currents from E (left, control; right, green tea extract). I: Mean TEVC current trace for KCNQ1 (left), with mean tail current magnified (right). J: Mean TEVC current traces for uninjected oocytes in the absence (Control) or presence of GTE. K: Left, mean tail current; right, mean tail current fold-change verses prepulse voltage for traces as in J (n = 5). L: Scatter plot of unclamped membrane potential (EM) for cells as in E (n = 5). Statistical analyses by two-way ANOVA. M: Mean TEVC currents from uninjected oocytes (J) subtracted from mean KCNQ1/E1 currents (E). N: Left, mean tail current; right, mean prepulse current verses prepulse voltage for traces as in M (n = 5).